[1]:
%reload_ext autoreload
%autoreload 2

import itertools
import numpy as np
from scipy import spatial
from pythonworley import noisecoords, worley
import pylab as plt
/home/docs/checkouts/readthedocs.org/user_builds/pythonworley/envs/latest/lib/python3.11/site-packages/pythonworley/__init__.py:4: UserWarning: pkg_resources is deprecated as an API. See https://setuptools.pypa.io/en/latest/pkg_resources.html. The pkg_resources package is slated for removal as early as 2025-11-30. Refrain from using this package or pin to Setuptools<81.
  from pkg_resources import get_distribution
Matplotlib is building the font cache; this may take a moment.
Generate Worley noise centers and Voronoi tesselation
Worley noise and Voronoi tesselation work on any random centers. However, random centers placed at regular grid give us an easy way to make a pattern that can be seamlessly tiled in any direction.
[2]:
# Set grid shape for randomly seeded gradients
shape = (8,4)

# Generate grid noise and set flag boundary=True
# to pad it with periodic boundary points
noise = noisecoords(*shape, boundary=True, seed=0)

# Fltten X, Y coordinates and generate Voronoi tesselation
coords = noise.reshape(2,-1).T
vor = spatial.Voronoi(coords)
vert = vor.vertices
edge = vor.ridge_vertices
face = vor.regions


plt.figure(figsize=(12,6), facecolor="grey")

# Fill faces with random colors
rand = np.random.uniform(0.2, 0.8, len(face))
color = plt.get_cmap("Greys")(rand)
for i, f in enumerate(face):
    if len(f) and min(f) > 0:
        v = vert[f]
        plt.fill(v[:,0], v[:,1], c=color[i])

# Draw edges
for e in edge:
    if min(e) > 0:
        v = vert[e]
        plt.plot(v[:,0], v[:,1], c="black", lw=12)

# Plot centers
plt.scatter(*noise, c="black", s=200)

# Set xlim and ylim to hide periodic boundary padding points
plt.xlim(0, shape[0])
plt.ylim(0, shape[1])
plt.axis('off')
plt.show()

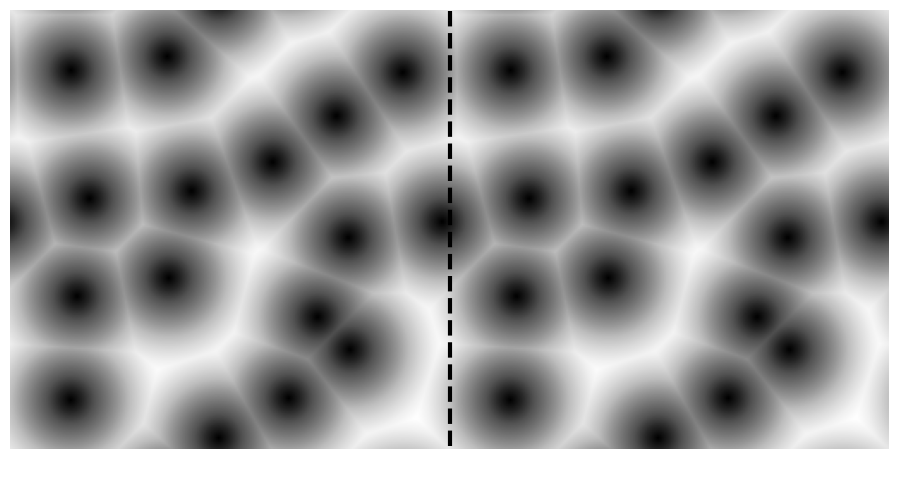
Generate cellular noise
Worley noise produces cellular noise pattern when colored dark to light as the distance to noise centers increases.
[3]:
# Set grid shape for randomly seeded gradients
shape = (4,4)

# Set density - output shape will be dens * shape = (128,128)
dens = 64

# Generate noise and centers
w, c = worley(shape, dens=dens, seed=0)

# Worley noise is an array of distances to the Nth closests neighbour center.
# Select the first (the smallest). Then transpose, because plt.imshow treats axis 0 as the "Y".
w = w[0].T

# Test that noise tiles seamlessly
w = np.concatenate([w] * 2, axis=1)

plt.figure(figsize=(12,6))
plt.imshow(w, cmap=plt.get_cmap('Greys_r'))
plt.plot([256,256], [0,256], '--k', lw=3)
# plt.scatter(*c, c= "r")
plt.axis('off')
plt.show()
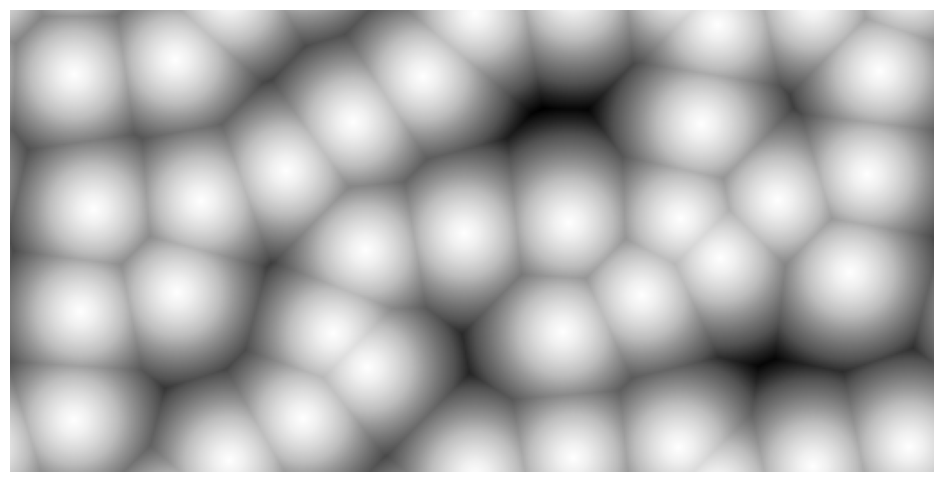
Generate bubble pettern
Worley noise produces bubble pattern when colored light to dark as the distance to noise centers increases.
[4]:
dens = 64
shape = (8,4)
w, c = worley(shape, dens=dens, seed=0)
w = w[0].T

plt.figure(figsize=(12,6))
plt.imshow(w, cmap=plt.get_cmap('Greys'))
# plt.scatter(*c, c= "r")
plt.axis('off')
plt.show()
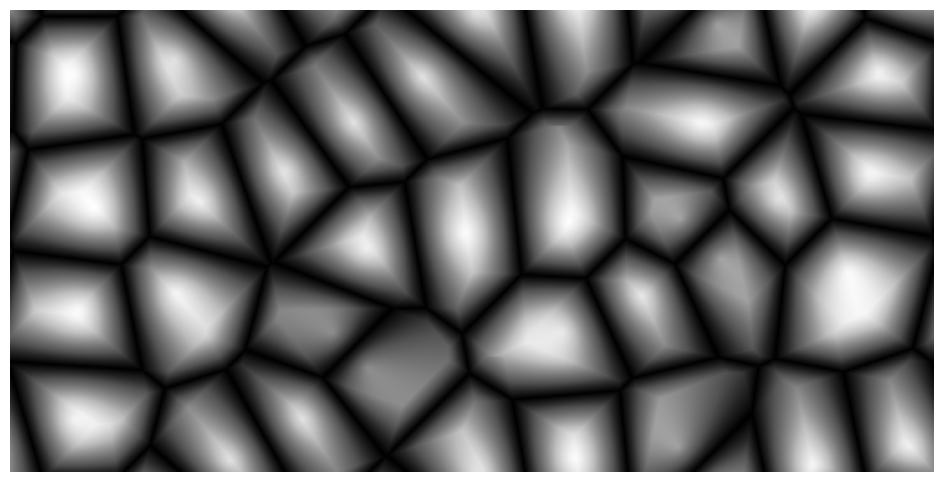
Generate cobblestone pattern
Worley noise produces ccobblestone pavement pattern when taking the difference between the smallest and the second smallest distances from the Worley noise array.
[5]:
dens = 64
shape = (8,4)
w, c = worley(shape, dens=dens, seed=0)
w = w[1].T - w[0].T

plt.figure(figsize=(12,6))
plt.imshow(w, cmap=plt.get_cmap('Greys_r'))
# plt.scatter(*c, c= "r")
plt.axis('off')
plt.show()
Procedural star field
When generating a random star field, a problem is how keep stars apart. Unfortunately random placememts tends to put some stars extremely close to each other.
An elegant solution is to place stars based on the grid noise. Though we do not use Worley noise in this example, the grid noise is similar to that we used to generate Worley noise centers above.
[6]:
shape = (20,10)

# Make rectangular grid
x, y = np.arange(shape[0]), np.arange(shape[1])
x, y = np.meshgrid(x, y, indexing="ij")

# Generate noise: random displacements r at random angles phi
np.random.seed(0)
phi = np.random.uniform(0, 2 * np.pi, x.shape)
r = np.random.uniform(0, 0.5, x.shape)

# Shrink star size to keep it inside its cell.
# Alse, we want more small stars - for the background effect.
# To do that we rescale displacements: r -> 1/2 - 0.001 / r.
r = np.clip(0.5 - 1e-3 / r, 0, None)
size = 200 * (0.5 - r) - 0.4

# Convert r and phi to cartesian coordinates using Euler formula.
z = r * np.exp(1j * phi)
dx, dy = z.real, z.imag
x, y = x + dx, y + dy

plt.figure(figsize=(12,6), facecolor="black")
plt.scatter(x, y, c="white", s=size)
plt.axis('off')
plt.show()

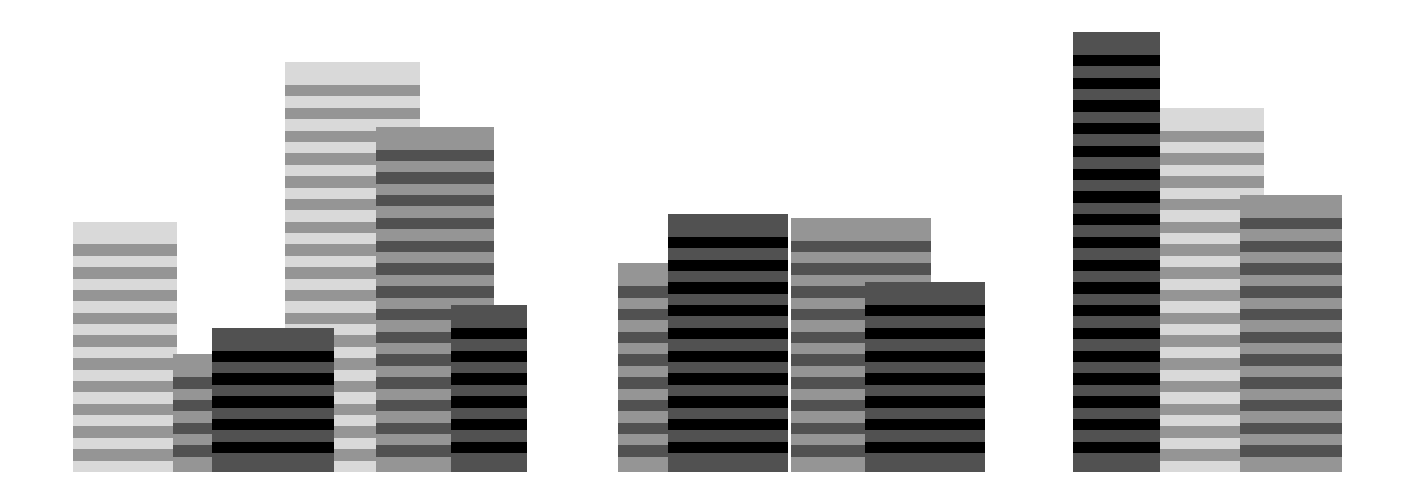
Procedural cityline
Again we do not use Worley noise itself in this example. Instead we generate a random cityline based on the grid noise which is similar to that we used to generate Worley noise centers above.
[7]:
# Function to plot a building based its randomly generated center, width, and height
def plot_building(center, width, height, floor_color, window_color, floor=3, basement=0):
    nfloor = int(height)
    if nfloor > floor:
        colors = [[window_color, floor_color] for i in range(nfloor - 1)]
        colors = [floor_color] * 2 + list(itertools.chain(*colors))
        heights = floor * np.arange(1, 1 + 2 * nfloor)[::-1] + basement
        centers = np.ones((2 * nfloor)) * center
        plt.bar(centers, heights, width=width, color=colors)


nblock = 6 # Number of blocks per line
nline = 3 # Number of lines
w = 20 # Average block width

# Generate grid noise
np.random.seed(0)
rand = np.random.uniform(0, w, (nline, 3, nblock))

# Plot blocks line by line
plt.figure(figsize=(18,6), facecolor="w")
for i in range(nline):
    darkness = (i + np.arange(2) + 1) / (nline + 1)
    floor_color, window_color = plt.get_cmap("Greys")(darkness)
    center, width, height = rand[i]
    center += 3 * w * np.arange(nblock) + w * i
    width += w
    for j in range(nblock):
        plot_building(center[j], width[j], height[j],
                      floor_color, window_color, basement=i)
plt.axis('off')
plt.show()
[ ]: